
Maximum Bearishness, Maximum Opportunity
Leveraged shorts hit extreme levels just as 30-Year yields peaked. A look at the structural setup for a failed bond breakdown and our latest performance metrics.

Editor’s Note: I first highlighted the extraordinary speculative bearish position in the 30-Year Treasury Bond in my special video report on May 17th titled “The 19-Year Yield Breakout: Reality vs. The Crowded Trade.”
I’ll be updating my thoughts on the long bond in this update; however, if you missed that video update, I recommended checking it out via the link above.
—EG
In the most recent Bank of America Global Fund Manager Survey, a net 44% of the 200 funds surveyed indicated they’re underweight bonds.
That’s the largest net underweight since mid-2022 when the Fed was just embarking on the most aggressive tightening campaign since Paul Volcker was Chairman of the Fed back in the early 1980s, amid a generational surge in inflation.
Meanwhile, leveraged fund speculators in the US 30-Year Treasury and Ultra 30-year Treasury Bond futures are just coming off the largest short position in history:
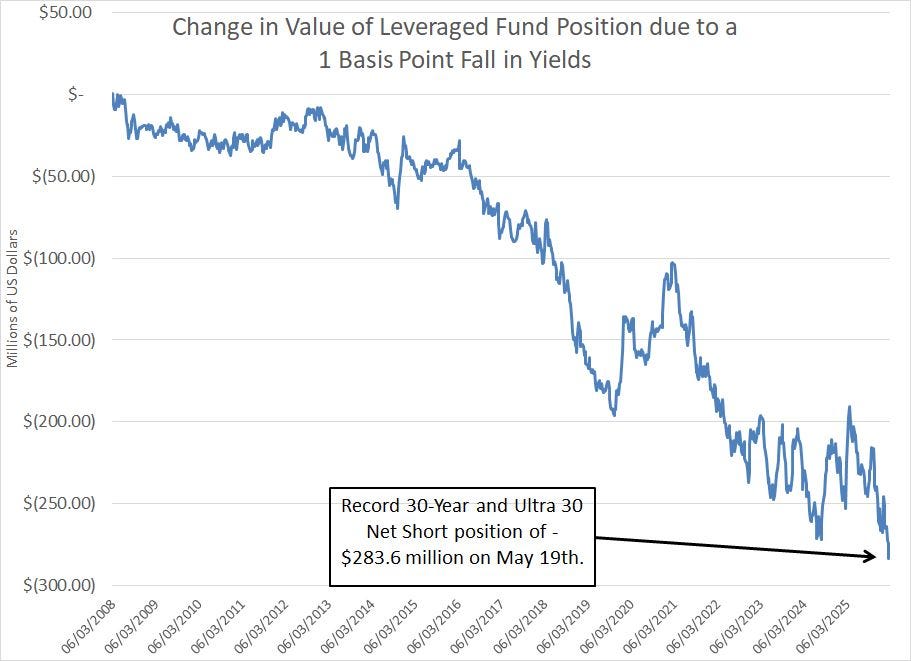
Source: Commodity Futures Trading Commission (CFTC) Commitment of Traders Report
This chart shows the duration value of 1 basis point (DV01) – this is the net change in the value of leveraged funds’ short position for a 1 basis point change (0.01%) in long-term Treasury Bond yields. In this case, speculators are net short bond prices, so a 1 basis point FALL in yields (rise in bond prices) would produce a net loss of $276.7 million.
This data was released on Friday May 29th and represents trading positions as of the close the prior Tuesday (May 26th). And we’re just barely off the record DV01 level of -$283.60 million set the prior Tuesday on May 19th.
Of course, as I’ve explained, the total size of the US Treasury Bond futures market has grown considerably since the late 2000s, so comparing the sheer size of a net short position today to a position 5 or 10 years ago is a little misleading.
However, even if we compared the current position to the average over the past 104 weeks (two years), the current speculative short position in the long bond is extreme:
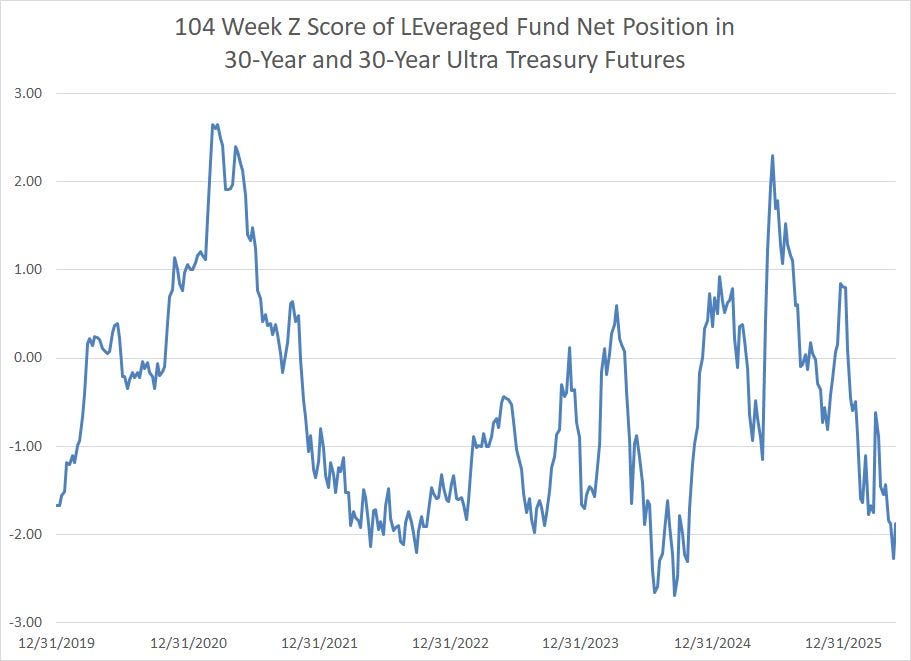
Source: CFTC Commitment of Traders Report
On May 19th, the net position in 30 Year Treasury and 30-Year Ultra futures was a whopping 2.27 standard deviations below the 104 week average.
Simply put, everyone is bearish bonds.
The stagflation and higher-for-longer rates narratives were the crowd consensus just as 30-Year Treasury bonds started to break above their erstwhile trading range:
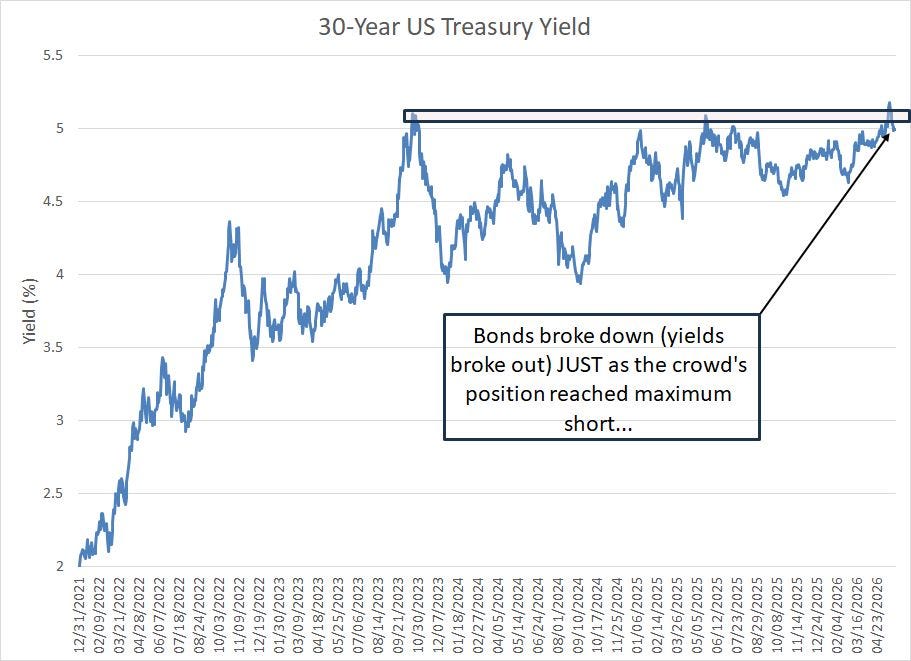
Source: Yahoo Finance Retrieved Using Python Script
This chart shows the yield on the 30-Year Treasury bond since the end of 2021. As you can see, we’ve been trading in a range between roughly 4% and 5.10% since the summer of 2023.
And bonds broke down (yields broke higher) just as speculative sentiment in the Treasury futures market reached maximum bearish levels in mid-to-late May.
That’s the speculative pain trade at work: A classic recipe for a failed breakdown in bonds.
Sure enough, from an intraday peak of 5.20% on Wednesday May 20th 30-Year Treasury yields have reversed sharply lower and back to around 4.97%, back into that longstanding trading range.
Given the sheer scale of that bearish bet in bonds, it wouldn’t take much of a catalyst to drive a sizable wave of short covering in the long bond that sends yields tumbling back closer to the middle of this longstanding range. The list includes a softer than expected jobs report this week, soothing language out of the Fed at its upcoming meeting on June 17th or some sort of concrete evidence of a deal to re-open the Strait of Hormuz.
And with speculators already so bearish the 30-Year Treasury bond, and the Fed Funds futures market already pricing in 1 to 2 Fed rate hikes over the next year (By the June 9, 2027 meeting) it will be difficult to generate meaningful upside momentum in yields from current levels. Put in a different way, with bears so fully committed, there’s quite likely limited capital on the sidelines to push yields even higher.
The Quiet, Sleep-Easy Bull Market
Meanwhile, amid all the talk of near 20-year highs in 30-Year Treasury yields, a hawkish Fed and resurgent inflation, many investors I speak to assume that returns in the bond market must be pretty dismal these days.
However, nothing could be further from the truth and if you’re ignoring bonds, you’re missing out:
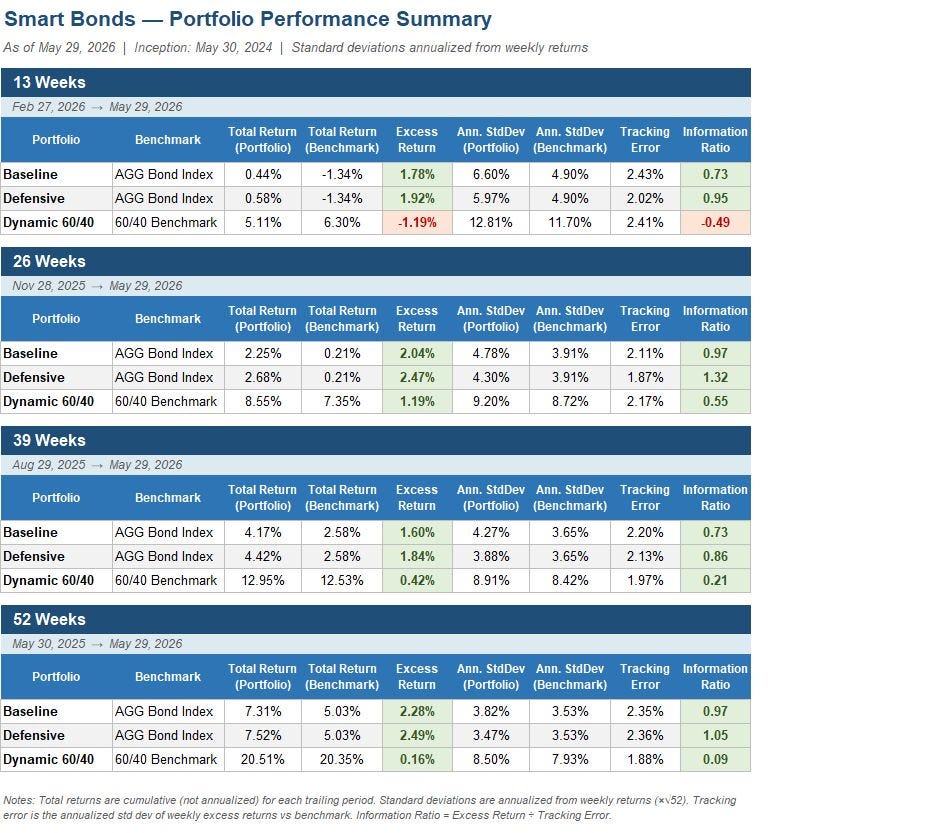
Source: Smart Bonds, Yahoo Finance Retrieved Using Python Script
There are three model portfolios in Smart Bonds—The Baseline, Defensive and Dynamic 60/40 Portfolios --and this table summarizes total returns, risk and key performance metrics for all three of our model portfolios over trailing periods of 13 weeks (1 quarter) through 52 weeks (1 year) ended Friday May 29th.
Most of the reported columns are self-explanatory including total returns (capital gains and ETF distributions), excess returns compared to the portfolio benchmark and standard deviation (a measure of annualized price volatility and risk).
The table also includes two additional columns to provide more granularity on returns and risk:
Tracking Error -- Measures how consistently a portfolio’s returns differ from its benchmark. Specifically, it’s the annualized standard deviation of the weekly return differences between the portfolio and its benchmark.
A lower tracking error means the portfolio tends to move in lockstep with the benchmark; a higher one means the portfolio takes more independent positions. For the bond portfolios here, tracking error reflects active allocation decisions across credit quality, duration, and sector rather than simply holding the index.
For context, index funds typically have tracking errors below 0.5%, while actively managed bond funds generally run between 1% and 3%. A tracking error above 4% to 5% would suggest a portfolio that bears little resemblance to its benchmark. For the bond portfolios here, tracking error reflects active allocation decisions across credit quality, duration, and sector rather than simply holding the index.
Information Ratio (IR) -- Puts those active decisions in context by dividing the portfolio’s excess return over the benchmark by its tracking error. It answers the question: how much outperformance are you getting for each unit of active risk taken?
An IR above 0.5 is generally considered good, and above 1.0 is considered excellent. A negative IR simply means the portfolio underperformed its benchmark over that period.
So, here’s a quick review:
Baseline Model Portfolio
The Baseline Portfolio recommends only bond, credit and preferred stock exchange traded funds (ETFs) listed for trading on the major US exchanges. Our benchmark for this portfolio is the iShares Core US Aggregate Bond ETF (NYSE: AGG), which tracks the Bloomberg US Aggregate Bond Index, a common benchmark for bond funds.
Essentially, the Bloomberg US Aggregate Bond Index tracks the universe of investment grade bonds in the US, including US Treasuries, Mortgage-Backed Securities and investment grade corporate debt.
Over the trailing 52 weeks, despite all the hype about a “weak” bond market, our Baseline portfolio is up 7.32%, besting its benchmark by 2.28% despite a standard deviation that’s only 0.19% annualized higher than AGG at 3.82%.
A lower standard deviation means less price volatility (lower risk).
To put the Baseline Portfolio’s 3.82% annualized volatility into perspective, over the same trailing 52-week period, the annualized standard deviation of the S&P 500 was 11.8% and over the past two years it’s 15.17% annualized. So, based solely on historical trading data, the Baseline Portfolio carried less than one-third (32.4%) of the volatility of the S&P 500 over the past 52 weeks.
Simply put, we’re not buying a bunch of high-volatility, high risk ETFs to beat our Baseline Model portfolio benchmark, and the information ratio near 1 suggests we’re being well compensated for allocating the model portfolio to ETFs that deviate from the standard benchmark (AGG) allocations.
Two of our biggest “macro” overweights in the Baseline Portfolio over the past year have been global bond market ETFs that have generally offered superior returns and a currency translation kicker, as well as our exposure to non-investment grade markets that have generated far superior returns to the Treasury and investment grade US corporate bond market that dominate the AGG benchmark.
Defensive Model Portfolio
Our Second Portfolio is the Defensive Model Portfolio, which we also benchmark to the AGG fund. Like the Baseline, it’s entirely allocated to bond, credit and preferred stock ETFs.
The goal here is to generate similar returns to the Baseline Portfolio with lower portfolio standard deviation.
While the Baseline Portfolio still edges out the Defensive Portfolio since the inception of the Smart Bonds service, the latter has actually outperformed the Baseline over the past 52 weeks, returning 7.52% despite an annualized standard deviation at 3.47% that’s lower than both the Baseline Portfolio (3.82%) and the AGG benchmark (3.53%).
This model portfolio’s strong return and risk profile generated an information ratio of 1.05 over 52 weeks and 1.32 over 26 weeks.
Dynamic 60/40 Portfolio
Finally, there’s the Dynamic 60/40 Portfolio which we benchmark to a portfolio invested 40% in AGG and 60% in the SPDR S&P 500 ETF (NYSE: SPY) which tracks the S&P 500 Index.
Our Dynamic 60/40 portfolio is an active model portfolio that differs from the traditional 60/40 portfolio in three main ways:
First, as you might expect, the 40% of the portfolio allocated to “bonds” is allocated to a curated selection of the bond, credit and preferred stock ETFs recommended in the Baseline portfolio.
Second, rather than simply allocating the equity portion of the Dynamic 60/40 portfolio to the S&P 500, we also will occasionally allocate a portion of the equity portfolio to other broad market indices.
And third, we adjust the recommended relative weights in the stock and bond portions of the model portfolio based on our discretionary assessment of the health of the broader stock and bond markets as well as some simple price and economic indicators we follow. This portfolio is designed with the flexibility to allocate as little as 20% to stock/equity ETFs (80% to bond, credit and preferred ETFs) up to as much as 80% in stocks and 20% in our Baseline ETFs.
Over the trailing 52 weeks, our Dynamic 60/40 portfolio has bested the 60/40 benchmark by 0.16%, returning 20.51%, through the annualized standard deviation is slightly higher at 8.50% compared to 7.93% for the benchmark.
Given how strong the equity market – and traditional 60/40 model portfolio – has been over the past year, it’s been more difficult to pull ahead and generate significant outperformance as we have in the Baseline and Defensive portfolios. However, it’s tough to argue with a 1-year trailing return that’s almost 70% that of the S&P 500 — and over 20% — with a roughly 28% decline in standard deviation relative to the S&P 500.
Unlock the Full Smart Bonds Portfolio
You’ve seen the performance. While the broader market gets whipsawed by headlines, our disciplined, data-driven approach is quietly delivering sleep-easy outperformance.
But outperformance requires knowing exactly where to allocate. Below, we break down our current model portfolio holdings, target allocations, and the specific ETFs we are eyeing.
As I mentioned above, our comprehensive Quarterly Update Issue is due out by early July, and I am already eyeing a couple of adjustments to our allocations.
To ensure you don't miss these critical adjustments, upgrade today and take advantage of an extended 60-day FREE trial. You'll unlock this week's full model portfolios, our immediate flash alerts, and the complete July Quarterly Update at zero risk.
I’d also note that since late November last year (trailing 26 weeks), a period when stocks have been decidedly more volatile, the Dynamic 60/40 Portfolio has exhibited solid outperformance, besting the benchmark by almost 1.2%.
Here’s a look at the model portfolios as of the market close on Tuesday June 2, 2026:
Keep reading with a 7-day free trial
Subscribe to Smart Bonds to keep reading this post and get 7 days of free access to the full post archives.