


Warning: Never Rush the Duration Trade
Adding two new recommendations to the model portfolio...

Amid all the talk of tariffs, elevated inflation, Moody’s downgrade of the US credit rating and a hawkish Federal Reserve this year, you might think it’s been a tough year for the bond market.
However, that’s just not the case.
Indeed, unless you’ve been aggressively buying long duration US government bonds, you’re probably beating the S&P 500 by a comfortable margin in 2025:
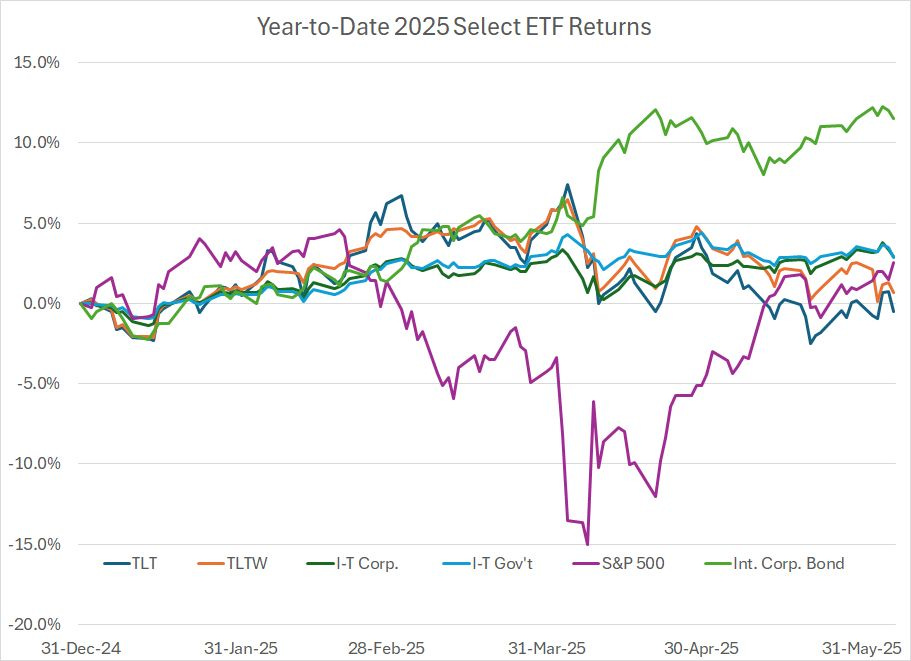
Year-to-date through the close on Friday June 6th, the S&P 500 is up 2.5% including dividends and the only fixed income ETFs on my chart that have underperformed stocks are the iShares 20+ Year Treasury ETF (NYSE: TLT) and iShares 20+ Year Treasury BuyWrite (NSDQ: TLTW), which are down 0.5% and up 0.7% respectively. TLT has a duration of just under 16 years, making it among the more rate-sensitive bond ETFs in my coverage universe.
The iShares 20+ Year Treasury Bond BuyWrite ETF (NSDQ: TLTW) owns units of TLT and sells out-of-the-money call options to generate additional premium income. As I’ve explained before in these updates, TLTW performs best when long-term Treasuries are rangebound, which is a good description of the action so far this year and, for that matter, much of 2024. That’s why, despite the fact it owns long-term Treasury exposure, TLTW is still up 0.7% year-to-date.
Meanwhile, ETFs recommended in the model portfolio tracking intermediate term US corporate and government bonds are up 2.9% to 3% this year while the recommended ETF tracking international corporate bonds denominated in currencies other than the US dollar, has soared more than 11.5% year-to-date in 2025, beating the S&P 500 by 9 percentage points with a fraction of the price volatility of the US stock market.
Simply put, bonds aren’t getting hit this year – all but two of the 19 ETFs recommended in the Smart Bonds model portfolio are up year-to-date.
The problem is one of popularity and perception.
You see, the iShares 20+ Year Treasury Bond ETF (NYSE: TLT) is the largest fixed income ETF in the US with close to $50 billion in assets under management (AUM). It’s widely owned by individual investors and, for that reason, it’s often discussed as a sort of proxy for the US bond market in the financial media.
Some individual investors I speak to seem to regard TLT as their go-to buy when they’re looking to buy Treasuries as a haven amid concerns about recession or in anticipation of Fed rate cuts.
As I’ve been writing since last summer, understanding duration is crucial when managing a portfolio of bonds, preferred and credit ETFs such as we track in the Smart Bonds model portfolio. Duration is simply a measure of interest rate sensitivity – the longer/higher a bond, or bond ETF’s duration, the more the price will rise when rates fall and vice versa.
I’ve spilled considerable digital ink regarding the details of how I seek to manage duration through the market and economic cycle in past issues and updates of Smart Bonds, so let’s keep it simple this month.
When the economy is strong, and the Fed is likely to raise or maintain elevated short-term rates, I generally seek to keep our duration exposure on the short side in the model portfolio. For example, our favorite short-term Treasury Bill ETF currently offers a yield of more than 4.2% and, even if the Fed were to resume hiking rates, this fund would see no significant price risk. Rising short-term rates would, however, result in rising monthly distributions, and a higher yield, for this fund.
Also, when the economy is strong and rates are rising, you’ll often see relative strength in floating rate ETFs.
If you’re interested in seeing our three model Smart Bonds portfolios, including the two new recommendations in this issue, I’m offering 30-day FREE trials to the paid tier of Smart Bonds as part of our June quarterly special offer.
To claim your free trial, click here:
That includes senior loan ETFs, which buy portfolios of bank loans to corporations. Corporations generally pay a spread over common short-term interest rate benchmarks to borrow money. For example, a company might borrow at a 300-basis point (3%) spread over the 30-day Treasury Bill yield or 3% over the Secured Overnight Financing Rate (SOFR) – as rates, and yields on these benchmarks rise, the interest rate paid on loans resets higher.
Unlike fixed income (bond) markets, a portfolio of loans benefits from rising short-term rates as it drives up the interest rates paid by borrowers, and the yields offered by these ETFs.
Floating rate preferred stocks and bonds can also perform well in a rising or elevated interest rate market.
Finally, high-yield or “junk” bonds typically outperform Treasuries and investment grade corporates in this scenario because the tailwind of receding credit risks in a strong economic environment often outweighs the headwind of rising rates.
However, there comes a time in every market and economic cycle I call the “Great Duration Tipping Point.” This is the point when the economy begins to slow meaningfully, the risk of recession rises and the Federal Reserve pivots in favor of cutting rates and easing monetary policy. And that’s when you want to start adding duration to your portfolio while cutting exposure to more economy-sensitive markets like corporate bank loans and high-yield bonds.
In the extreme case – a recession where the Fed is easing aggressively – long duration US Treasuries provide a haven when most other assets are getting hit hard. This is when duration really shines.
The good news is that individual investors can access a dizzying array of specific niches of the US and global bond, preferred and credit markets using exchange-traded Funds (ETFs) that can be purchased using your normal brokerage account. At least some of these niches can generate strong income and total returns in just about every economic and market environment you can imagine.
The bad news is that timing the shifts in the cycle – and the Great Duration Tipping Point – is not an exact science.
As I just noted, when the economy shows signs of slowing, and the Fed begins to pivot in favor of cutting rates, that’s a good time to start adding duration.
The operative word here is “Start.”
My approach in Smart Bonds is to gradually adjust our duration exposure over time in response to incoming economic data and market signals rather than recommending large, sudden shifts in portfolio exposure. Dramatic portfolio adjustments in response to ever-changing economic, market and political narratives represent a dangerous recipe for painful whipsaws and reversals.
That’s particularly true when it comes to popular, widely followed long-duration ETFs like TLT. Such instruments are useful and, as I’ll cover in just a minute, they certainly have their place.
However, don’t make the mistake of equating the words “bonds” and “fixed income” with safety.
It’s true that Treasuries have no credit risk – the US government can repay debt priced in dollars, a currency it can also print. However, Treasuries, especially long-term Treasuries in an ETF like TLT, exhibit significant price volatility and risk of loss.
Just consider:
In 2022, TLT lost 31.2% of its value including the benefit of monthly ETF distributions.
That compares to a loss of (just) 18.2% in the S&P 500 in the same calendar year.
Indeed, an investor who bought America’s most popular bond ETF on the final trading day in 2021 is still down almost 35% including distributions today, more than 3 years later.
Is it really any wonder that some investors might conclude that bonds are a bad investment?
This year provides an excellent illustration of why it’s important to manage your duration risk carefully over time and, when building a portfolio of bonds, you MUST look beyond TLT.
And that brings me to this:
The 2025 Tariff Recession Whipsaw
Just over two months ago, the US stock market collapsed in response to larger-than-expected tariffs announced by the Trump Administration.
Specifically, over just 10 trading days between the close on March 25th and April 8th, the S&P 500 lost 13.7% of its value. On the morning of April 9th, Goldman Sachs economists pegged the probability of a US recession at 65% over the next 12 months.
And there were some potential signs of a weakening US economy long before President Trump’s Rose Garden tariff announcement on April 2nd.
In the March 2, 2025 issue of Smart Bonds “A Classic Growth Scare,” I wrote about fading fiscal stimulus tailwinds as the incoming Trump Administration sought to reduce government spending and payrolls. As I explained in that issue, government jobs have been responsible for a far larger-than-normal share of new job creation in recent years.
In “Economic Jitters, Adding Duration” and “Soft Data Complacency,” I wrote about worrying trends we were seeing this spring in survey-based “soft” economic data like the Institute for Supply Management’s (ISM) Manufacturing Purchasing Manager’s Index (PMI).
And, in the March 14th issue “The Economy, Credit Spreads and Global Rotation,” I also wrote about a nascent-but-troubling spike in high-yield credit spreads, a measure of the rates paid by high-yield borrowers compared to the yield on Treasuries of equivalent duration.
In short, there were plenty of warning signs in stocks, bonds and the economic data back in March to suggest the US might be approaching the “Great Duration Tipping Point” I outlined earlier.
However, investors who went all-in on that pivot would have been crushed buying duration in late March and early April.
After President Trump announced a 90-day pause on tariffs for most countries April 9th, the S&P 500 soared, and Goldman Sachs was forced to reverse its recession call, just a few hours after it was made.
If you’d bough the iShares 20+Year Treasury ETF on April 3rd, the trading day after the tariffs were announced, you’d now be down almost 7% including distributions. Meanwhile, if you’d sold the SPDR Blackstone Senior Loan ETF (NSDQ: SRLN), a popular ETF tracking the loan market, over recession fears as the simple duration playbook I’ve outlined would suggest, you’d have missed out on a rally to new cycle highs in recent sessions.
Given the dramatic shifts in sentiment toward stocks, the economy, the Fed and key economic fundamentals this year, it’s crucial NOT to overreact to every piece of incoming news.
To be transparent, I did recommend adding some duration exposure to the Smart Bonds Model Portfolios back in the March 4th issue “Economic Jitters, Adding Duration.” Specifically, in our Baseline Model Portfolio, I recommended adding a small position in the aforementioned iShares 20+ Year Treasury ETF, equivalent to 3.5% of the total hypothetical model portfolio value.
I also recommended adding to both our intermediate-term US corporate and government (Treasury) bond ETFs – I recommended adding a 2% portfolio weight to our existing exposure in both ETFs.
In my view, by early March trends in the economic data and market signals had deteriorated enough to merit a small increase in duration in the model portfolios. However, investors are better off waiting for more obvious signals of impending recession before adding aggressively to duration by purchasing a sizable position in long duration ETFs like TLT.
The good news is that of these three recommendations only TLT is trading lower since the close March 4th and, since the recommended TLT position was on the small side, the overall damage from the ETF’s roughly 6% subsequent decline is modest.
Meanwhile, as I’ll explain in a moment, our more aggressive allocations since February in favor of special situations like international and emerging market bonds, high-yield international corporate bonds and inflation-protected securities have paid off.
Let’s start with this:
Focus on the Belly First
History shows investors who attempt to anticipate a recession too early, trying to be a hero in the duration trade, expose their portfolios to excess volatility and run the risk of getting burned:
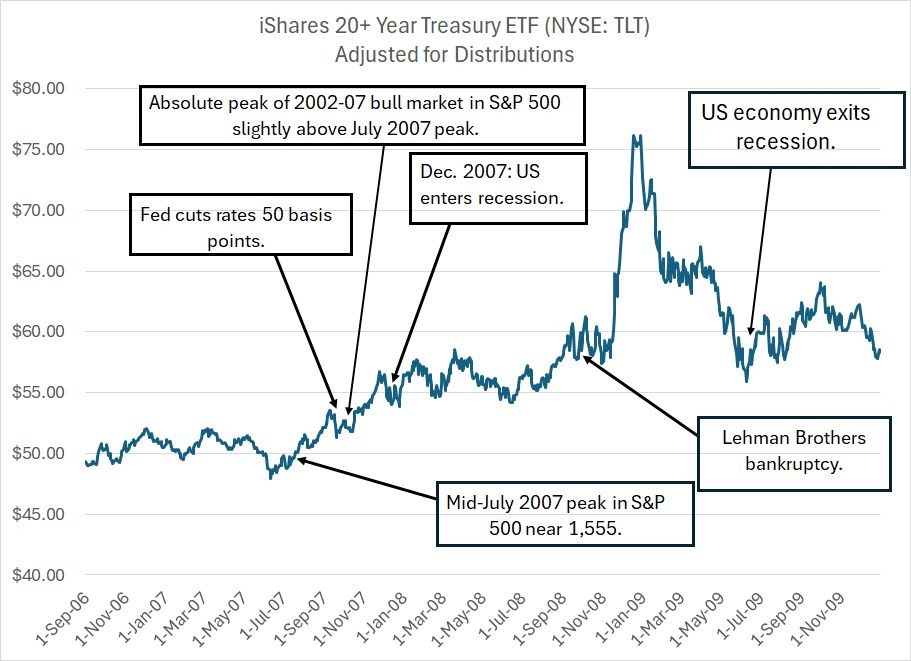
This is a chart of the iShares 20+ Year Treasury ETF from late 2006 through the end of 2009, a period that includes the 2007-09 Great Recession and financial crisis as well as a vicious bear market in the S&P 500 from October 2007 through early March 2009.
I’ve labeled a handful of key events over this period, and I’ve adjusted the price of TLT so it reflects distributions paid each month on this ETF.
Leading up to the June 29, 2006 Fed meeting, the central bank raised interest rates by 25 basis points (0.25%) for 17 consecutive meetings. The Fed then paused for more than a year before cutting rates by 50 basis points on September 18, 2007.
As you can see on my chart, TLT was dead money from the summer of 2006 through the summer of 2007. That’s despite the fact the stock market saw a nasty sell-off in the summer of 2007 amid the first warning signs of the impending financial crisis.
Chief among those were the failure of New Century Financial, a subprime mortgage lender in the summer of 2007 and the failure of two Bear Stearns hedge funds due to losses in mortgage bonds in July of the same year. French banking giant BNP Paribas announced that there was no liquidity for mortgage assets held by 3 of its hedge funds and froze investor withdrawals.
TLT finally began to rally into September 2007 in anticipation of a Fed rate cut that month. Indeed, the central bank followed through with a 50-basis point cut, a move likely intended as a signal to markets that it was alert to building stress in credit markets.
However, take another look at my chart above and you’ll see that TLT was, once again, dead money for about a year from the time of the Fed’s first cut in the cycle through early September 2008, just ahead of the Lehman Brothers bankruptcy.
Keep in mind that by late August 2008 the Fed had already slashed rates from 5.25% to just 2%, the US economy had already been in recession for 9 months, Bear Stearns had already collapsed, acquired for a pittance by JP Morgan Chase (NYSE: JPM). The S&P 500 had already declined by as much as 23.8% from its October 2007 intraday peak.
In short, the worst economic and credit crisis since at least the early 1970s and arguably since the Great Depression was well underway, a scenario tailor-made for buying long-duration Treasuries yet there was still no need to rush into the trade.
Investors could have gradually added to their duration exposure through late 2007 and the first 8 months of 2008 as economic conditions deteriorated and still benefited from most or all the upside in Treasuries at the height of the crisis in Q4 2008.
Before it’s obvious a recession is already underway, investors are often better off focusing on the belly of the curve in the form of ETFs exposure to intermediate-term Treasury and investment grade corporate issues:
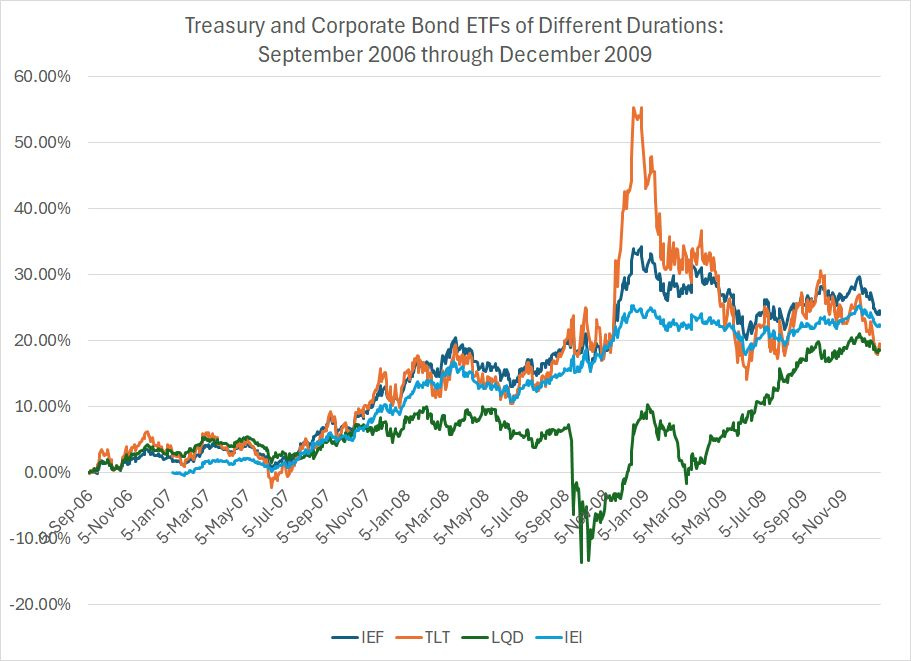
This chart examines the same period – from September 2006 to December 2009 through the Great Recession and financial crisis years – I highlighted in my TLT chart earlier.
In this chart, I’m showing the total return – capital gains and monthly distributions – for four different fixed income ETFs of different durations. I’m using total return data rather than prices, so the returns from all three ETFs are comparable.
In this case, the dark blue line represents the iShares 7-10 Year Treasury ETF (NYSE: IEF), which owns a portfolio of US Treasury Bonds with a duration of about 7 years. The orange line is the iShares 20+ Year Treasury ETF (NYSE: TLT) with a longer duration of 16 years (more rate-sensitive) while the light blue line is the iShares 3 to 7-year Treasury ETF (NYSE: IEI) with a duration of a little over 4 years (less rate sensitivity than IEF).
Finally, the green line is the iShares iBoxx Investment Grade Corporate Bond ETF (NYSE: LQD), which tracks investment grade US corporate bonds and has a duration of approximately 7 to 8 years.
A few points to note here.
Despite the fact this cycle brought a severe recession, investors didn’t need to reach for duration to benefit from the historic 2008 bull market in fixed income.
The performance of the three Treasury ETFs in my chart – IEI, IEF and TLT – was close to identical from September 2006 through to September 2008 despite the fact that IEI and IEF have lower duration and, accordingly, far less interest rate sensitivity and day-to-day price volatility than TLT.
Indeed, IEF outperformed TLT on a cumulative basis up until around December 2008.
In this cycle, investment grade corporates represented by LQD on my chart, began to lag in the spring of 2008, mainly due to rising fears of default, especially from investment grade financial issuers, as the economic downturn and credit crunch worsened.
The lesson: Even in a (severe) recession scenario, investors are better off focusing on intermediate-term Treasuries through much of the cycle rather than reaching for long-duration ETFs like TLT, even long after the recession is underway.
There’s no need to be overly anticipatory or to “call” a recession 6 or 12 months early to catch the rally in long duration government bonds.
Also note that by the end of 2009, just 6 months after the Great Recession ended, investors in IEI and IEF performed significantly better on a cumulative basis than buyers of TLT. Indeed, even LQD played catch up with the other bond ETFs on my table by the end of ’09.
The other obvious advantage of focusing your attention on the middle of the curve is that intermediate-term Treasury and investment grade corporates can also provide solid returns if the US avoids recession or the Fed sticks a soft landing.
I wrote about this phenomenon last October in “Soft Landing: Many Bond Niches Thrive.”
A classic example is the period from the end of 1994 through the end of 1999. The Fed Chairman at that time, Alan Greenspan, focused on making modest tweaks in interest rate policy over time to address incoming data on growth, labor market conditions and inflation. The 1994-95 and 1997-98 periods have long been considered classic examples of Fed “soft landings” where the central bank successfully brought down inflation by hiking rates without tipping the economy into recession.
Over this 5-year period, none of the bond ETFs I just covered were listed for trading. However, intermediate-term bond indices such as the Bloomberg US Treasuries Index managed positive returns of more than 7.25% annualized straight through the late 1990s despite the fact there was no recession.
This, in a nutshell, is why I advocate a gradual approach to adding duration in the Smart Bonds model portfolio. While I recommended a small position in TLT back in early March, the position-weighted average duration of the Baseline model portfolio continues to hover around 4 years and our recommended positions in belly-of-the-curve ETFs tracking government and investment grade corporate bonds remain several times larger than the recommended position in TLT.
As I’ll cover in just a moment, I see more downside than upside in both 10- and 30-year US Treasury bond yields. Since falling bond yields implies rising prices, this outlook represents a modest bullish bias for ETFs like TLT going forward.
Yet, I still believe it’s too early to get more aggressive on the duration trade, particularly through vehicles like TLT.
Also note that while I recommend a small position in TLT, I don’t recommend IEF, LQD and IEI in the model portfolios. I‘m using the latter three funds for illustrative purposes because all were available for trading through all, or most of, the 2007-09 Great Recession cycle.
As I’ll cover in the Actions to Take section below, our favorite intermediate-term Treasury Bond fund has a lower expense ratio than IEF and IEI and a duration of about 4.9 years, which implies slightly more interest rate risk than IEI (4.32 year duration) and significantly less than IEF (7.1 years currently).
Meanwhile, my favorite intermediate term corporate bond ETF has a duration of about 6 years, which is less than LQD’s 8 years.
However, before we dive into the economic outlook and my outlook for Treasury yields, it’s important to remember that while the duration trade and the direction of Fed policy are important, they are far from only considerations when investing in bond, credit and preferred stocks and related ETFs.
Indeed, so far in 2025, ETFs tracking more specialized niches of the bond market have provided most of our outperformance relative to bond market benchmarks.
Topping that list is this:
Global Fixed Income
We recommended some exposure to non-US, non-US dollar bond markets in the Smart Bonds model portfolios heading into 2025; however, we’ve added significantly to that position this year.
Specifically, on March 14th, I added positions in two international bond ETFs to the model portfolio, including one focused on non-US dollar investment grade corporate bonds and a second that tracks high-yield “junk” bonds issued outside the US in currencies other than the US dollar.
A few weeks later on April 4th, in “Bonds, Inflation and Commodities,” I added a new bond ETF tracking inflation-adjusted bonds issued by governments outside the US including the United Kingdom, Brazil, France, Italy and Japan.
Finally, a about a month ago on May 9th I recommended a new position in an emerging markets government bond fund with exposure to local currency bonds issued by countries like India, China, Malaysia and Brazil.
These new international bond recommendations have been among the top-performing ETFs in the model portfolio this year and I’m looking for more absolute and relative upside through the balance of 2025 as well.
I’ve covered the rationale for these recommendations at some length in recent issues; however, it’s worth reiterating two key, related points today.
First and foremost, all the new international fixed income ETFs we recommended this year benefit from a weaker US dollar. That’s because they’re buying bonds issued in foreign currencies like the British pound, the euro, Canadian dollar, Japanese yen and Brazilian real and they don’t use currency hedging tools to reduce their exposure to fluctuations in the value of the US dollar.
There are plenty of international bond ETFs, including a couple in the model portfolio, that seek to reduce or eliminate their foreign currency exposure. And there’s certainly a time and a place for that; however, my view has been, and remains, that the dollar is likely to weaken generally over the next few years.
Take a look:
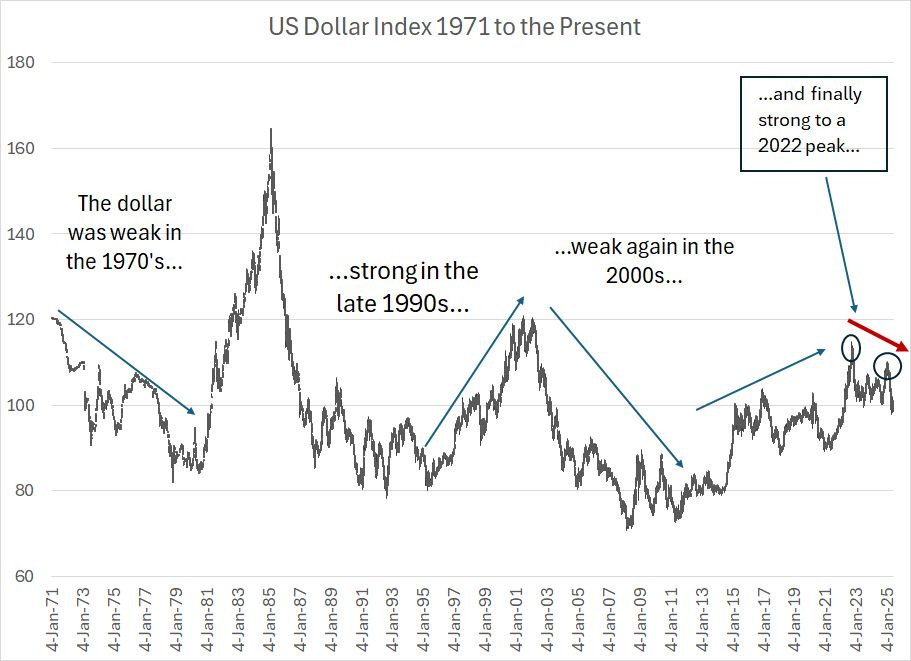
I took this weekly chart of the US Dollar index back to the early 1970s, so you can get a read on the longer-term trends at work.
Over this 50+ year period, the dollar has been through multiple cycles.
In the 1950’s and through most of the 1960s US equities (stocks) offered strong returns and the US economy flourished; however, amid the high-inflation decade of the 1970s, returns from US financial assets deteriorated.
According to a long-term asset return study from Deutsche Bank, US stocks generated returns of 19.3% annualized in dollar terms from 1950-59 and 7.8% in the period from 1960-69. However, in the 1970’s equities generated an annualized gain of just 5.8%, which when adjusted for the sky-high inflation of that era, plunges to a loss of -1.5% annualized.
During periods of US economic and market exceptionalism, the dollar has historically been strong. However, periods of US exceptionalism are usually followed by multi-year periods when assets like foreign equities and commodities are in favor and the dollar weakens.
Look at my chart of the dollar index above and you’ll see in 1971 the US dollar Index was trading around 120, falling to the low 80s by the late 1970’s and early 1980s.
I call these major multi-year cycles the “Great Cycle.”
This Great Cycle shifted again in the early 1980s, back in favor of the US. In the 1980s and 1990s, US stocks generated inflation-adjusted returns (real returns) of 11.8% and 14.8% annualized respectively. In the late 1990s, in particular, US stocks soared, led by strong gains in technology stocks and the Nasdaq 100, dominating returns from most international markets.
In this period of US exceptionalism, the dollar generally strengthened. Indeed, the dollar was so strong in the early and mid-1980s, the governments of the US, (West) Germany, Japan, France and the UK met at the Plaza Hotel in New York City, signing an agreement known as the Plaza Accord to intervene in currency markets to weaken the dollar.
That trend continued until the 1987 Louvre Accord to stabilize the dollar.
However, government machinations can only go so far and by the late 1990s strong performance for the US economy and financial assets once again resulted in a stronger US dollar with the US dollar index peaking around 120 in 2000-01.
Of course, while the 1980s and 1990s were generally a great period for the US dollar and US financial assets – both stocks and bonds – it was a terrible period for commodity prices, an asset class that had dominated returns through the 1970s.
I won’t belabor the point by going into great detail regarding the cycles since the late 1990s. Suffice it to say that the period from 2002 – 08 roughly corresponds to a period of international stock outperformance over the US, a weaker US economy, and weakness in the US dollar.
Commodities were a bright spot in this era including major bull markets in gold from the late 1990s to 2011/12 and for oil from the late 1990s to peaks in 2008 and 2014.
The cycle then repeated once again in favor of US assets – broader strength in the US Dollar Index from 2008 through the late 2022 peak, which represented a lower high relative to that 2002 top. This also corresponded to a bout of record-setting US equity market performance relative to the rest of the world and weakness in most commodities.
And that brings us to the current situation.
As you can see, the absolute peak for the US dollar was in late 2022 with the dollar making a second run at those highs early this year.
However, the dollar has now logged a lower high – the 2022 peak was higher than the January 2025 peak for the US Dollar Index – and it appears the US currency may be rolling over into a new downtrend.
Right on cue, international stocks have started to show signs of life since late 2022 and early 2023. These multi-year trends in relative strength take time to develop, and even trends in the dollar can be choppy at times, however, I believe we’re witnessing an historic shift similar to the early 1970s, early 1980s, mid-1990s, 2002-03 and 2008.
That’s a tailwind for international stocks relative to the S&P 500, for commodities and for currencies other than the US dollar. It’s also a boost for international fixed income priced in currencies other than the US dollar.
And that brings me to my second, related point.
Just consider that much like the late 1960s, early 70’s and the late 1990s, global investors and the mainstream financial media had fully embraced American exceptionalism theme towards the end of last year.
The Economist magazine ran a cover story “The Envy of the World” on October 19, 2024, referring to the US economy and featuring a fat roll of $100 banknotes blasting skyward like a rocket.
(Don’t be surprised if, in a few years’ time, we look back on that magazine cover calling the dollar’s top and the peak of US stock market relative outperformance this cycle).
And long-time readers know I follow Bank of America’s monthly Global Fund Manager’s Survey closely. It’s a monthly survey of active fund managers from around the world with combined assets under management of more than $500 billion.
The December 2024 update of this survey was titled “Max Americana,” and revealed a record-high overweight in US stocks based on data going back to 2001, and the biggest underweight in European stocks since October 2022. Investors surveyed were the most overweight the US relative to emerging markets since June 2012.
Investors were also heavily underweight commodities with the lowest net allocation there since the summer of 2017.
No one rings a bell at the top, but the level of complacency surrounding continued, superior returns from US assets and strength in the US dollar had reached historic extremes towards the end of last year.
That’s just the sort of extreme in sentiment that often leads to major reversals as we’ve seen this year.
And, while I believe many individual investors recognize the outperformance of non-US stocks this year, the global rotation in fixed income markets flies under the radar. That’s despite the fact global fixed income represents a lower-volatility way to benefit from the same basic international rotation theme:
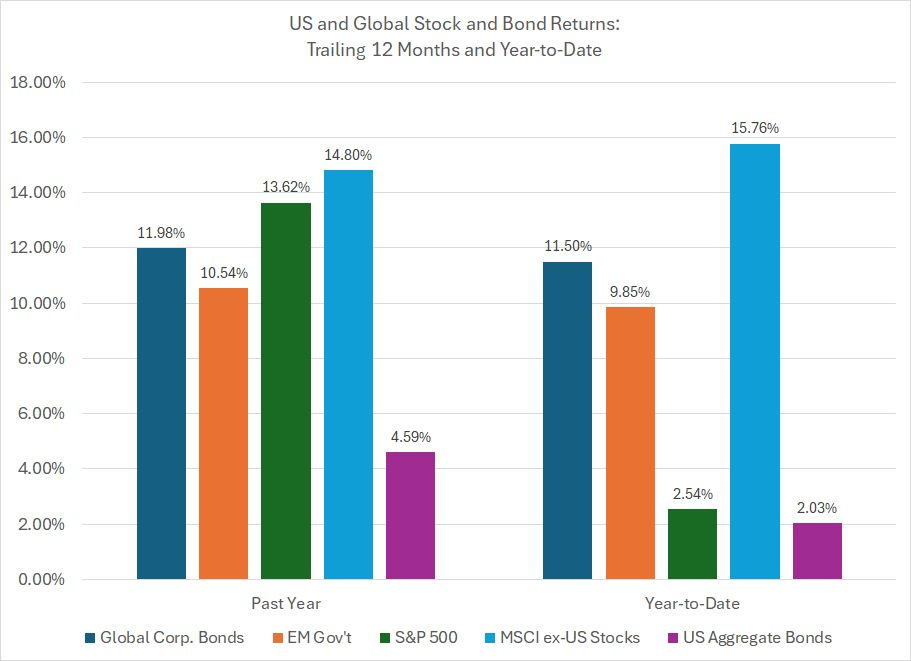
This chart shows the total returns for multiple stock and bond ETFs over the past 12 months and year-to-date.
On the equity side, look at the blue bar, which represents the performance of global stock markets excluding the US, compared to the S&P 500 in green.
In both return periods, global stocks are beating the S&P 500 including a whopping 13.22 percentage points of outperformance year-to-date.
However, the performance of global bond markets is (almost) as impressive. The purple columns represent the performance of the Bloomberg Aggregate US Bond Index that includes investment grade US corporates, Treasury and mortgage-backed securities. Over the past year this index is up just 4.59% compared to an 11.98% return for global corporate bonds (dark blue column) and 10.54% for emerging market bonds (orange column).
Year-to-date, global corporate bonds are beating the US Aggregate Bond Index by about 9.5 percentage points. And keep in mind the volatility of returns from global corporate bonds is more than 60% lower than the volatility of global stocks excluding the US.
My point is simple:
Global investors were heavily overweight US assets towards the end of last year, just as US outperformance in both equity and bond markets was peaking.
Even if global investors simply move back to a more neutral weight in the US relative to the rest of the world that represents a huge shift in assets out of US stock and bond markets and into global equities.
That’s what’s powering these historic rotations favoring international stocks and bonds.
However, I must warn you that while multi-year cycles like the Great Cycle are powerful wealth builders, they also rarely move in a straight line. If history is any guide, and the current cycle is similar in duration to prior cycles, we’ll see this broad trend out of the US dollar, in favor of commodities and global assets, continue well into the coming decade.
Yet, in the context of that longer term trend, there’s little doubt we’ll see periods of US equity and bond market outperformance in coming years even as the broader rotation remains intact.
Indeed, I believe we’re at risk of some countertrend rotations this summer.
Earlier on, I mentioned the Bank of America Global Fund Manager survey from last December titled “Max Americana.” The most recent edition of the survey, released in the middle of May, shows a significant shift in global allocations.
For example, from a record high overweight in US stocks late last year, fund managers surveyed are now a net 38% underweight US equities, the lowest allocation to US stocks in about two years. It appears investors are particularly bullish on Europe – investors are the most overweight EU vs. US equities since October 2017.
A net 19% of investors surveyed now say they’re underweight the US dollar compared to foreign currencies.
To be clear, much of this survey reports investors’ positioning in global stock markets rather than the bond markets we cover here in Smart Bonds. However, given the parallel rotation we’ve seen this year favoring fixed income markets outside the US, it’s reasonable to conclude that investors have shifted significant fixed income assets out of the US this year.
I don’t believe the global rotation is over, not by a long shot.
In 2002-08, for example, US assets generally underperformed though there were short periods of US outperformance, and increased allocation to US stocks, within that trend.
However, given the speed of the shift we’ve seen favoring global markets this year, markets looked primed for a countertrend move favoring US assets this summer. At a minimum, I’m looking for erstwhile market leaders like US tech stocks to play a bit of catch up with international stocks this summer.
One final point on the same topic. As I noted earlier, the most dramatic global rotation has favored Europe this year; indeed, according to the May Bank of America Global Fund Manager survey, global investors are still underweight Japanese and Emerging Market stocks relative to long-term historical averages.
On a tactical basis, this has me favoring our emerging market fixed income ETF exposure over the next few months.
With these points in mind, I’m making two new additions to the Smart Bonds model portfolios in this issue.
The first represents a modest shift and rebalancing in our exposure to preferred stocks, and the second, a recommended position in an under-the-radar corner of the bond market that looks well-placed to benefit from a rebound in the US stock market into this summer.
Let’s jump in, starting with this:
Keep reading with a 7-day free trial
Subscribe to Smart Bonds to keep reading this post and get 7 days of free access to the full post archives.